
Our guest blogger this week is Sam Piper, Senior Planner, Alta Planning + Design (@altaplanning). Alta Planning + Design designs and implements bicycle and pedestrian infrastructure for cities and institutions. This is Part 1 of 2 blogs by Mr. Piper.
A new study from Imperial College London published in April 2016 had startling findings: “There are now more adults in the world classified as obese than underweight.”
The study, which pooled data from 183 countries, found that “the number of obese people worldwide had risen from 105 million in 1975 to 641 million in 2014”. While the World Health Organization previously set a goal to have no rise in obesity above 2010 levels by 2025, the new research predicts that the probability of reaching this goal is “close to zero.”1
Negative health outcomes and obesity trends have coincided with other major trends. Consider the correlation between the growth in American obesity during a period over which Vehicle Miles Traveled (VMT) have persistently increased nationwide. In recent years, this trend has halted, with VMT actually decreasing.
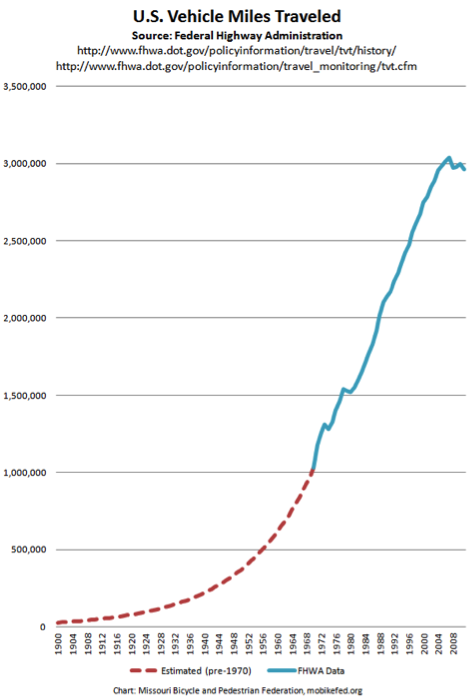 This dip has been attributed to a variety of factors, including the Great Recession, the recent growth in urban populations (which for the first time since the 1920s exceeded the growth of suburban areas), a diversification of transportation options (think car share, uber, lyft, and real time transit information) among other factors.
More recent data indicates that VMT growth rates could be shifting to pre-recession rates, and it is yet to be seen if the reduction in driving will last.
Regardless, the growth in obesity levels has steadily increased during this period: “Over the past 35 years, obesity rates have more than doubled. The average American is more than 24 pounds heavier today than in 1960.”
What has attributed to this incessant rise in obesity?
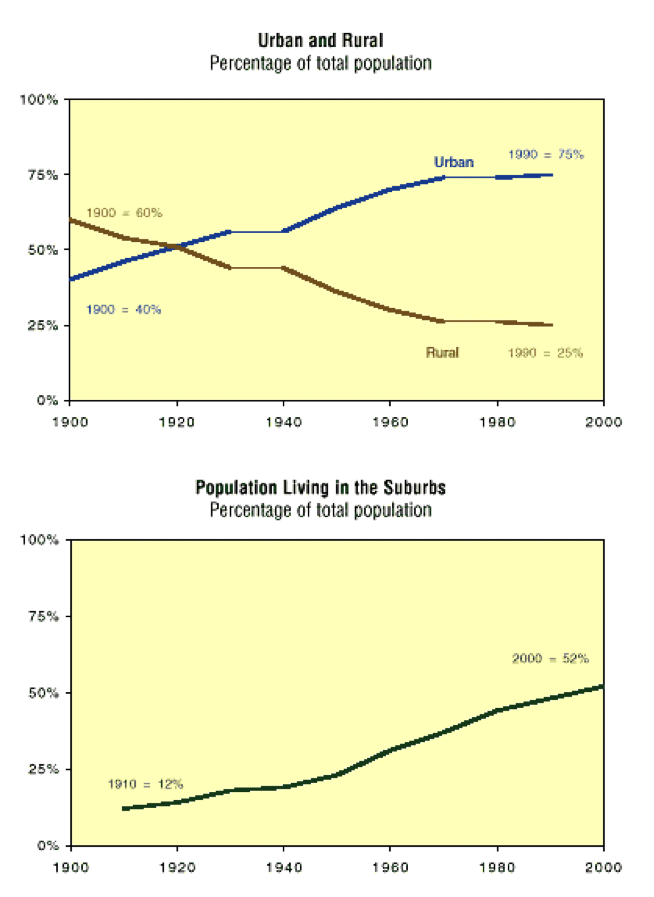
One factor is the fundamental change to the American built environment that has occurred over the past 100 years, which encourages sedentary lifestyles. At the turn of the 20th century, most people lived in farming communities (60 percent) and worked labor intensive jobs, while 28 percent lived in dense, walkable cities. Relatively few people at this time, about 12 percent, lived in “suburban” areas.2
By 2000, the landscape of America had drastically altered, with the majority of Americans (52 percent) living in sprawling suburban communities designed to move vehicles.
Although correlation is not causation, that our culture is so dependent on the automobile for daily life has impacted, to some degree, our health and our well-being. Most Americans now live in places where it is uncomfortable to walk or bike for most trips, making driving the most viable option for transportation. Multiple data sources indicate that a majority of people, 76 percent (according to 2013 data) drive alone to work.
Cities and states across the country are well aware of the obesity epidemic. As a result, they are working to prioritize bicycling and walking infrastructure development to provide more healthy travel options. Doing so represents an attempt to halt the growth of obesity through transformative tools such as complete streets programs and safe routes to school programs.
Transportation planners and engineers rely on data to develop better infrastructure and to prioritize investments. Longitudinal data on vehicular travel is robust, but equivalent data for walking and bicycling is almost non-existent. The ability to access more robust data helps communities:
- Determine where investments in walking and biking infrastructure are most needed
- Assess changes over time, draw conclusions about the impact of new facilities, and improve the design of future facilities
- Understand crashes involving people walking or bicycling more than is typically possible with crash data alone
- Quantify the benefits of walking and biking, which ultimately makes active transportation projects more competitive for funding
Fortunately, there are a number of current and emerging technologies that can capture and process non-motorized data efficiently and economically. After researching several of these technologies, Alta Planning + Design, a company that designs and implements bicycle and pedestrian infrastructure for cities and institutions, is excited to announce the publication of the Innovation in Bicycle and Pedestrian Counts white paper.
Learn more about Alta Planning and Design’s findings tomorrow in Part 2.
[1] http://www.thelancet.com/journals/lancet/article/PIIS0140-6736(16)30054-X/abstract [1] https://www.wvdhhr.org/bph/oehp/obesity/section1.htm [1] http://www.healthdata.org/news-release/vast-majority-american-adults-are-overweight-or-obese-and-weight-growing-problem-among [1] https://www.wvdhhr.org/bph/oehp/obesity/section1.htm [1] 2014 State Indicator Report on Physical Activity. National Center for Chronic Disease Prevention and Health Promotion. Division of Nutrition, Physical Activity, and Obesity.